Introduction
When I first set up a multi-node Kubernetes cluster on my Proxmox homelab, I made the mistake most engineers make: I learned enough kubectl to get Pods running and called it a day. It wasn’t until something broke silently in production — a Deployment quietly stuck at 2 of 3 replicas for hours — that I realised I had no real mental model of what the cluster was actually doing to fix (or fail to fix) itself.
That experience pushed me to stop treating Kubernetes as a black box. At the heart of every cluster is the Control Plane, the decision-making layer that continuously compares what you want with what actually exists and acts on the difference. Without understanding its components, debugging feels like guessing. Once you understand them, even the strangest cluster behaviour becomes traceable. This post breaks down the Control Plane architecture into practical concepts you can apply immediately.
The Architecture of Decision-Making
Worker Nodes are where your application containers actually run, inside units called Pods. The Control Plane never runs your workloads; it runs the logic that decides where workloads go, whether they are healthy, and what to do when they are not. It is a continuous reconciliation engine, not a one-time provisioner.
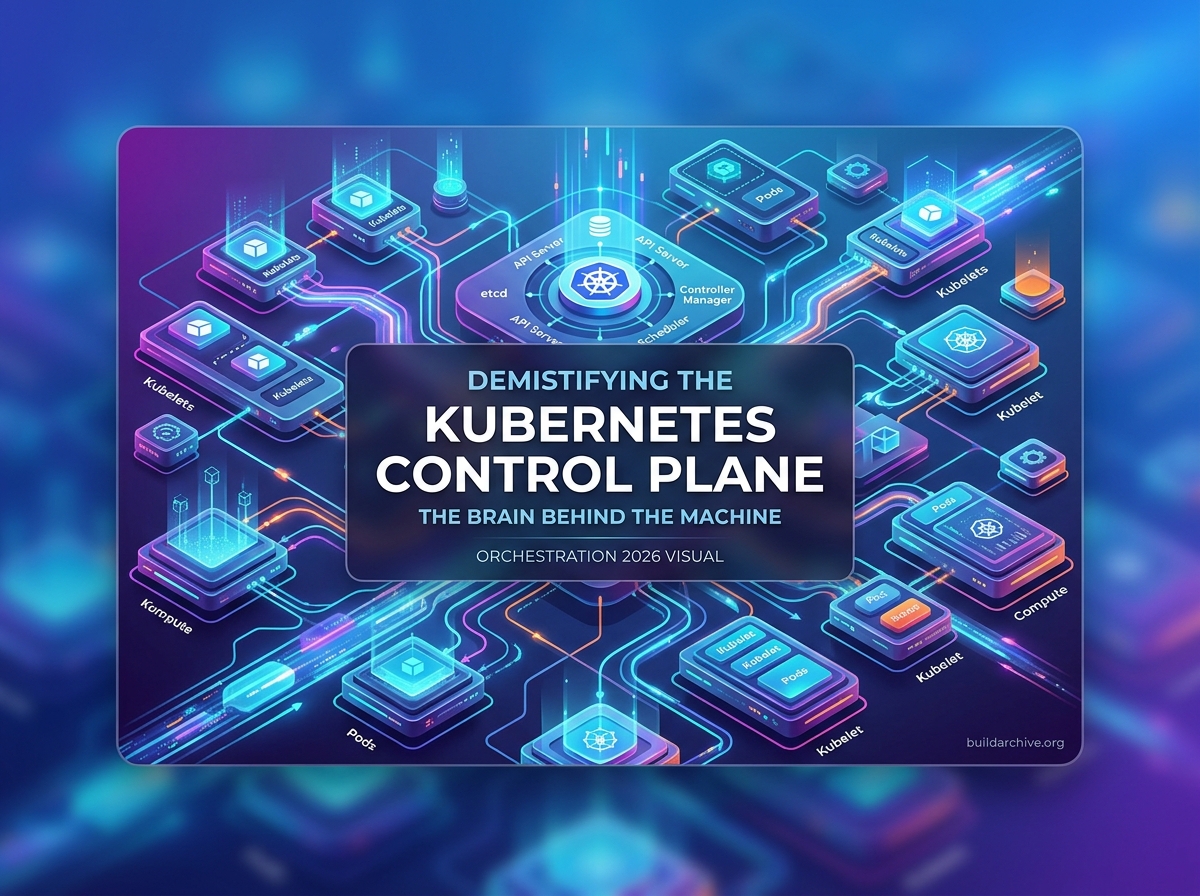
The Control Plane is composed of four primary components, each with a distinct and non-overlapping responsibility.
The API Server (kube-apiserver)
The API Server is the single entry point to the cluster. Every interaction — whether from kubectl on your laptop, a CI/CD pipeline running in GitHub Actions, or an internal cluster component — goes through the API Server. Nothing reads from or writes to the cluster state without passing through it first.
Its responsibilities break down into three stages that happen on every request. First, authentication and authorization: it checks who you are and whether your RBAC policies permit the requested action. Second, validation: it ensures your submitted manifest is syntactically correct and passes any active admission controllers or policy rules. Third, coordination: it writes the accepted state change to etcd and notifies any watching components that something has changed.
This last point is critical. The API Server does not act on your request directly. It records the intent and lets other components react. That separation of concerns is what makes Kubernetes so resilient.
etcd: The Source of Truth
etcd is a distributed, consistent key-value store and the only place where cluster state is permanently recorded. When you define a Deployment with 5 replicas, that specification lives in etcd. When the Scheduler assigns a Pod to a node, that binding is written to etcd. Everything else in the Control Plane is stateless; it derives what to do by reading from etcd.
The practical consequence of this is severe: if you lose etcd without a backup, your cluster is gone even if all your containers are still running on the nodes. The nodes have no way to reconcile their state, accept new work, or report health. In production environments, etcd should always run as a cluster of at least three nodes so that a single failure does not break quorum.
I back up etcd on a cron schedule to a separate Proxmox VM using etcdctl snapshot save, then verify the snapshot with etcdctl snapshot status. It takes under a minute and has already saved me once during a botched upgrade.
The Scheduler (kube-scheduler)
The Scheduler watches for Pods that have been created in etcd but have not yet been assigned to a node. For each unscheduled Pod, it runs a two-phase process: first it filters out nodes that cannot satisfy the Pod’s requirements (insufficient CPU, memory, missing labels, taints, etc.), then it scores the remaining nodes against criteria like resource balance and affinity rules. The highest-scoring node wins and the binding is written back through the API Server.
A key thing to understand is that the Scheduler only makes a decision — it does not start anything. Once it writes the node binding, its job is done. The actual container startup is handled by a completely separate component on the Worker Node.
The Controller Manager (kube-controller-manager)
The Controller Manager is a single binary that runs dozens of individual control loops, each responsible for a specific Kubernetes resource type. The Deployment Controller watches Deployments. The ReplicaSet Controller watches ReplicaSets. The Node Controller watches node health. Each loop follows the same three-step pattern: observe the current state, compare it to the desired state recorded in etcd, and issue API calls to close the gap.
This is the mechanism behind self-healing. If a Worker Node goes offline and takes three Pods with it, the ReplicaSet Controller notices the replica count has dropped below the desired number and creates replacement Pods. It does not know or care why the Pods disappeared. It only knows the count is wrong and acts accordingly.
Here is a simplified illustration of what that control loop logic looks like in pseudocode, which maps closely to how the actual Go source is structured:
// Simplified ReplicaSet control loop (pseudocode)
function reconcile(replicaSet) {
  const desired = replicaSet.spec.replicas;
  const current = countRunningPods(replicaSet.selector);
  const diff = desired - current;

  if (diff > 0) {
    for (let i = 0; i < diff; i++) {
      createPod(replicaSet.spec.template);
    }
  } else if (diff < 0) {
    const excess = selectPodsToDelete(replicaSet.selector, Math.abs(diff));
    excess.forEach(pod => deletePod(pod));
  }
  // If diff === 0, nothing to do. Loop runs again on next watch event.
}
This pattern — desired minus actual, then act — is repeated throughout Kubernetes and is worth internalising. Once you see it clearly in the Controller Manager, you start recognising the same pattern in tools like Terraform and even in how PM2 keeps Node.js processes alive. PM2’s --watch mode and its crash-restart behaviour follow exactly this logic: it has a desired process count, it observes actual process count, and it acts on the difference. The abstraction is the same; the scope is just smaller.
Practical Example: The Lifecycle of a Deployment
Abstract components make more sense when you trace a real operation through them. Here is what actually happens when you run kubectl apply -f my-web-app.yaml for a new Deployment requesting 3 replicas.
The API Server receives your request over HTTPS, authenticates your credentials against the cluster’s certificate authority, checks your RBAC permissions, validates the manifest, and writes the Deployment object to etcd. At this point nothing is running anywhere.
The Deployment Controller, which is watching etcd for Deployment objects, notices the new entry. It sees no corresponding ReplicaSet exists yet, so it creates one by making an API call back to the API Server, which writes it to etcd.
The ReplicaSet Controller now notices a ReplicaSet that specifies 3 replicas but has 0 Pods. It creates 3 Pod definitions — again via the API Server — and writes them to etcd. The Pods exist as records but are in a Pending state with no node assigned.
The Scheduler sees 3 unscheduled Pods. It evaluates your nodes, filters, scores, and writes a node binding for each Pod through the API Server.
On each target Worker Node, the Kubelet — an agent that runs outside the Control Plane — is watching the API Server for Pods assigned to its node. It sees the binding, talks to the local container runtime (containerd in most modern clusters), pulls the image if it is not cached, and starts the container. The Kubelet then continuously reports the Pod’s actual status back to the API Server so the Controller Manager can verify reality matches the record.
The entire chain — from your kubectl apply to a running container — typically completes in under ten seconds for a cached image. Every step is independently auditable via kubectl describe and kubectl get events.
To see this chain in real time, you can watch events filtered by your deployment name as the apply runs in a separate terminal:
# Watch events as your deployment rolls out
kubectl get events
  --field-selector involvedObject.name=my-web-app
  --sort-by='.lastTimestamp'
  -w
This gives you a live feed of every Control Plane decision — Scheduler bindings, ReplicaSet scale-ups, image pulls — as they happen. It is far more informative than polling kubectl get pods and wondering why something is still Pending.
Best Practices for Operating the Control Plane
Understanding the architecture changes how you approach day-to-day cluster management. Three practices have had the most impact in my own setup.
Always define resources.requests on your containers. The Scheduler filters nodes based on requested resources, not actual usage. Without requests, it cannot make good placement decisions and you end up with over-provisioned nodes while others sit idle — or worse, nodes that get scheduled into OOM kills under load. For the Node.js microservices I run on Express, I typically start with cpu: "100m" and memory: "128Mi" as a baseline and adjust based on real Prometheus metrics rather than guessing upfront.
Run etcd with high availability in any environment that matters. Three nodes is the minimum for a fault-tolerant quorum. Beyond that, ensure your etcd backup job runs regularly and that you have actually tested a restore. A backup you have never restored is untested infrastructure. On my Proxmox homelab I treat the etcd restore procedure the same way I treat Docker volume restore drills — I run through it on a scratch cluster at least once per quarter.
Monitor API Server latency from the start. As cluster size and automation grow, the API Server becomes the first bottleneck. Prometheus exposes the apiserver_request_duration_seconds histogram by default, and a latency spike there will slow down every deployment, health check, and HPA scaling decision in your cluster. Setting a reasonable alert threshold early saves a lot of reactive debugging later.
Conclusion
The Kubernetes Control Plane stops feeling intimidating the moment you see it for what it is: four components, each with a narrow responsibility, working together in a continuous reconciliation loop. The API Server is the gatekeeper and coordinator. etcd is the persistent record of intent. The Scheduler is the placement decision-maker. The Controller Manager is the engine that enforces reality matches intent, indefinitely.
Every higher-level tool — Helm, Argo CD, Flux, even Terraform’s Kubernetes provider — is ultimately just writing objects to the API Server and letting these four components handle the rest. Mastering the Control Plane gives you a foundation that holds regardless of what tooling sits on top of it.