Introduction
Running a Node.js API in production — whether behind PM2 on a bare-metal Proxmox VM or inside a Docker container orchestrated with Compose — has taught me that the difference between a five-minute fix and a four-hour outage almost always comes down to how well you can see inside your running system. That gap between “something is broken” and “I know exactly why it is broken” is what separates basic monitoring from true observability.
Monitoring tells you that a system is broken; observability tells you why it is broken by allowing you to ask questions of your system that you did not anticipate in advance. As code moves from the initial ship phase into Day 2 operations, your ability to gain deep insight into application behavior determines your Mean Time to Recovery (MTTR) and, ultimately, the experience your end users have. This post explores the layers of a robust monitoring strategy, the evolution of the ELK stack, and how to transform raw data into actionable intelligence.
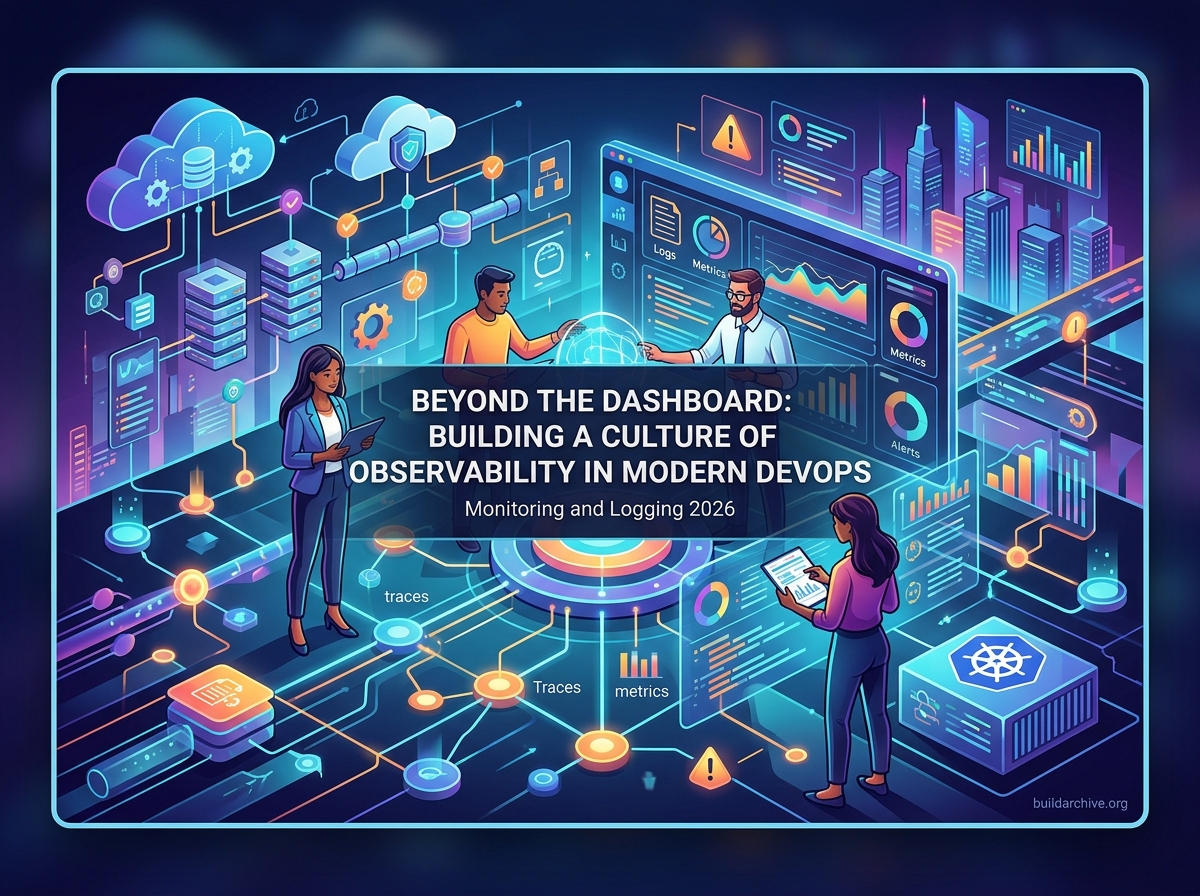
The Three Pillars of Observability
To build a comprehensive monitoring strategy, you need to look beyond basic uptime checks. Modern reliability engineering rests on three distinct types of data, often called the Three Pillars of Observability. Understanding how these interact is the first step in moving from a hope-based operations model to a data-driven one.
Metrics: The Pulse of Your System
Metrics are numerical representations of data measured over intervals of time. They are efficient to store and process, making them ideal for triggering alerts. In Kubernetes or cloud environments, tools like Prometheus scrape metrics from your services on a regular interval.
- Gauge metrics represent a single numerical value that can go up or down — for example, current CPU usage or memory consumption.
- Counter metrics are cumulative values that only increase — for example, the total number of HTTP 500 errors since the last restart.
- Histogram metrics track the distribution of values, such as request latency, which is critical for maintaining Service Level Agreements.
Logging: The Narrative of Events
Logs are immutable, timestamped records of discrete events that happened within your application. While metrics tell you that your error rate is spiking, logs tell you that a specific user failed to check out because of a null reference on a particular line of code. Within the ELK Stack — Elasticsearch, Logstash, and Kibana — logs are indexed and made searchable, allowing developers to perform forensic investigations into specific failures.
Distributed Tracing: Following the Journey
In a microservices architecture, a single user request might travel through ten different services before returning a response. If that request is slow, where is the bottleneck? Distributed tracing attaches a unique Trace ID to the request, letting you visualize the entire journey across service boundaries. This is the glue that connects metrics and logs in a distributed system, and tools like Jaeger or OpenTelemetry make it approachable even for smaller teams.
Centralized Logging with the ELK Stack and Beyond
Once you scale past a handful of services, logging locally to a file on a server becomes unworkable. You need a centralized repository. The ELK Stack has long been the industry standard, but the landscape is evolving with alternatives like Fluentd and Grafana Loki, the latter being particularly attractive if you are already using Grafana for metrics dashboards.
When implementing a centralized logging solution, a few practices make the difference between a log store you can actually query and one you end up ignoring.
- Structured logging: Avoid plain text logs. Use JSON format so that your logging backend can automatically parse fields like
user_id,environment, anderror_codewithout fragile regex patterns. - Log levels: Use levels — DEBUG, INFO, WARN, ERROR — appropriately. In production, running at INFO or WARN prevents log fatigue and keeps storage costs manageable.
- Correlation IDs: Ensure your application passes a request ID through every function call and service hop. This ID should appear in every log line related to that request, making cross-service debugging straightforward.
By integrating these logs with Kibana or Grafana, operations teams can create heatmaps of errors and correlate them directly with deployment timestamps from a CI/CD pipeline, creating a feedback loop between delivery and operations.
Structured Logging in a Node.js Express Application
Here is a practical example of how to wire up structured, JSON logging with correlation IDs in an Express API using the pino library. Pino is significantly faster than Winston for high-throughput services and outputs newline-delimited JSON that Logstash and Loki can parse without any additional configuration.
// logger.js
const pino = require('pino');

const logger = pino({
  level: process.env.LOG_LEVEL || 'info',
  formatters: {
    level(label) {
      return { level: label };
    }
  },
  base: {
    service: 'my-api',
    env: process.env.NODE_ENV
  }
});

module.exports = logger;
// middleware/requestLogger.js
const { v4: uuidv4 } = require('uuid');
const logger = require('../logger');

function requestLogger(req, res, next) {
  const correlationId = req.headers['x-correlation-id'] || uuidv4();

  // Attach a child logger bound to this specific request
  req.log = logger.child({ correlationId, method: req.method, url: req.url });

  req.log.info('request received');

  res.on('finish', () => {
    req.log.info(
      { statusCode: res.statusCode, responseTimeMs: Date.now() - req._startTime },
      'request completed'
    );
  });

  req._startTime = Date.now();
  res.setHeader('X-Correlation-ID', correlationId);
  next();
}

module.exports = requestLogger;
The key detail here is logger.child(). Every log line emitted anywhere inside the request handler automatically carries the correlationId, without having to pass it manually through every function. When this JSON lands in Elasticsearch, you can filter by that ID and instantly reconstruct the full narrative of what happened during that single request — even across multiple async calls to MongoDB or downstream services.
Effective Alerting: Combating Alert Fatigue
One of the greatest practical risks in any monitoring setup is alert fatigue. If your team receives a hundred Slack notifications a day, they will eventually begin ignoring them — including the one that actually matters. Your alerting strategy needs to be intentional and ruthlessly prioritized.
Actionable vs. Informational Alerts
An alert should only fire if a human needs to take immediate action. If a disk is at 80% capacity but will not fill for another three weeks, that is a ticket, not a page. If the database is completely unreachable, that is a page. The distinction matters because every unnecessary page erodes trust in the alerting system itself.
The Four Golden Signals
When configuring alerts in Prometheus or Grafana, focus on the Four Golden Signals defined in Google’s SRE handbook: latency (how long requests take), traffic (demand on the system, such as requests per second), errors (the rate of failed requests), and saturation (how full the service is, whether that means memory, thread pools, or connection limits). These four dimensions cover the vast majority of meaningful production incidents and give you a principled starting point rather than alerting on everything you can measure.
Implementing a Health Check Pattern in Express
Rather than simply checking whether a process is running, a well-designed service should expose a /health endpoint that performs real internal checks. Kubernetes uses these endpoints to decide whether to restart a pod or route traffic to it, so getting them right is directly tied to your service’s availability.
// routes/health.js
const express = require('express');
const mongoose = require('mongoose');
const router = express.Router();

// Liveness: is the process alive and not deadlocked?
router.get('/live', (req, res) => {
  res.status(200).json({ status: 'ok' });
});

// Readiness: is the app ready to serve traffic?
// Checks the MongoDB connection state before accepting requests.
router.get('/ready', (req, res) => {
  const dbState = mongoose.connection.readyState;

  // readyState 1 === connected
  if (dbState !== 1) {
    return res.status(503).json({
      status: 'unavailable',
      detail: 'database connection not ready',
      dbState
    });
  }

  res.status(200).json({ status: 'ok', dbState });
});

module.exports = router;
The readiness check is what separates a useful health endpoint from a superficial one. A pod can be alive — the Node.js process is running — but not ready because it has not yet established its MongoDB connection pool. Without a readiness check, Kubernetes will send traffic to that pod and your users will see errors for the first few seconds after every deployment. With it, traffic is only routed once the service is genuinely capable of handling it.
By combining these health endpoints with a centralized Grafana dashboard, you gain a single view across all your services. When a canary release is deployed, you can watch the error rate and latency in real time. If the error rate on the new version exceeds a defined threshold, the monitoring system can automatically trigger a rollback in the pipeline. This is what self-healing infrastructure looks like in practice.
Setting Service Level Objectives (SLOs)
Monitoring is useless if you’re alerted for every minor spike. To avoid alert fatigue, you need to define Service Level Objectives. For example: “99.9% of all successful API requests must complete in under 200ms.” By monitoring your error budget — the remaining 0.1% — you get a data-driven way to decide whether to ship new features or focus on stability. If the error budget is exhausted, the monitoring system signals a freeze on new deployments until reliability is restored. This removes the subjective argument from those conversations entirely.
Conclusion
Monitoring and logging are not features to bolt on after a project ships — they are part of the foundation. By moving toward a culture of observability, teams stop fighting fires reactively and start understanding their systems well enough to prevent incidents in the first place. Whether you are running the ELK stack for deep log analysis, Prometheus and Grafana for real-time metrics, or Loki for a lighter-weight log aggregation setup, the underlying goal is the same: genuine visibility into what your code is doing in production.
Ask yourself honestly — if your system failed right now, would you have the data to find the root cause in five minutes? Start by standardizing your logs into structured JSON with correlation IDs, then build out alerting around the Four Golden Signals. Incremental, intentional improvements compound quickly.