Introduction
When I first set up monitoring for my Node.js services running behind PM2, I thought checking whether the process was alive was enough. It wasn’t — not once I started dealing with intermittent MongoDB timeouts that only affected a subset of requests while everything else looked perfectly healthy. That experience pushed me deep into the world of observability, and what I found reshaped how I think about running software in production.
Simply knowing a service is “running” tells you almost nothing useful when something goes wrong. We need to know why a specific request failed for a single user in a specific geographic region while the rest of the system appears healthy. This shift has moved us from traditional monitoring — watching for known failures — to observability, which allows us to ask questions about our systems that we didn’t know we needed to ask. In this post, we’ll explore the critical trends reshaping monitoring and logging, moving beyond the standard ELK stack toward a more integrated, intelligent, and cost-effective future.
The Convergence of Logs, Metrics, and Traces
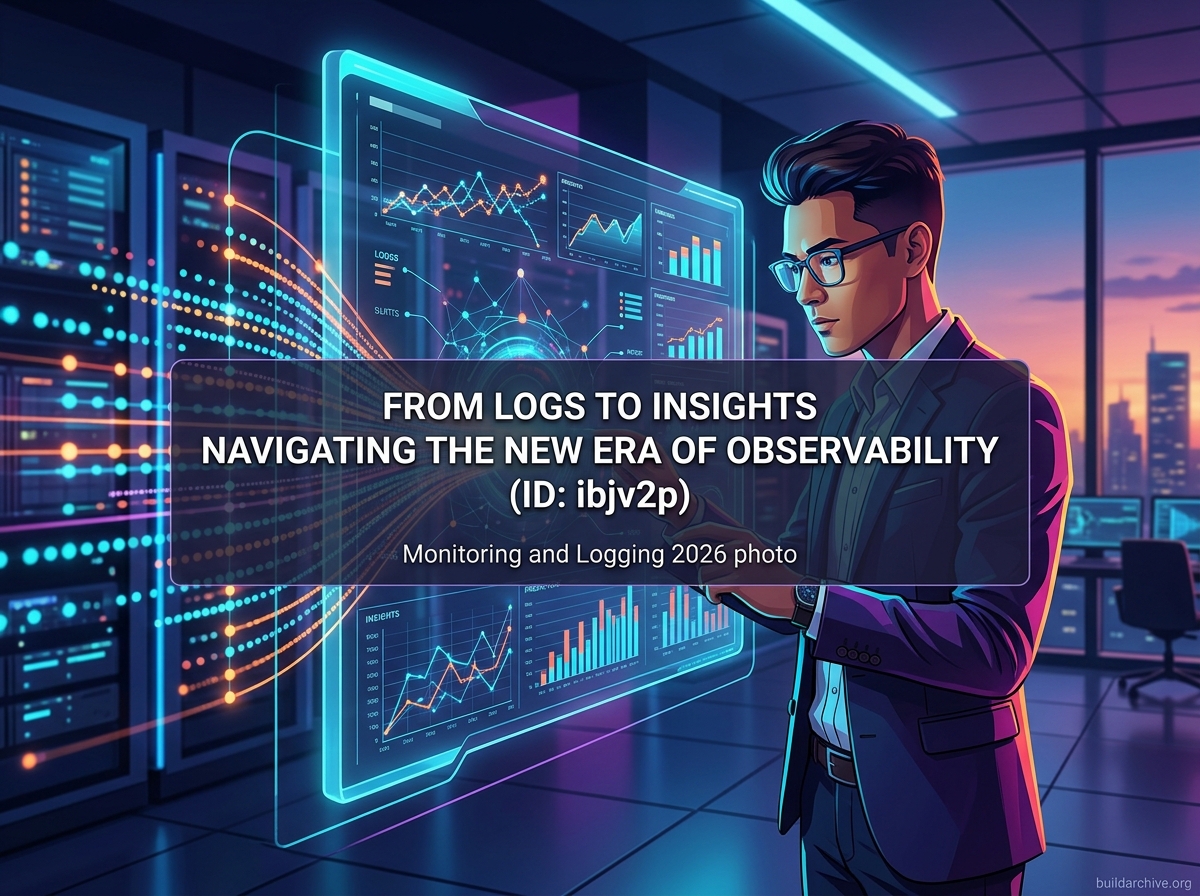
For years, engineering teams treated logs, metrics, and traces as three separate silos. You had your Prometheus server for metrics, your Elasticsearch cluster for logs, and perhaps Jaeger or Zipkin for distributed tracing. The current trend is the unification of these telemetry types into a single pane of glass. When an alert triggers, the modern engineer expects to click on a metric spike and immediately see the correlated logs and the specific trace ID associated with the latency.
The Rise of OpenTelemetry (OTel)
One of the most significant shifts in the industry is the adoption of OpenTelemetry. Before OTel, teams were often locked into proprietary agents provided by vendors. If you wanted to switch from one monitoring platform to another, you had to re-instrument your entire codebase. OpenTelemetry provides a standardized, vendor-agnostic way to collect telemetry data, effectively decoupling how you collect data from where you send it.
- No vendor lock-in: You can switch backends (for example, from Datadog to Grafana Cloud) without changing a single line of application code.
- Unified API: A single set of libraries handles logs, metrics, and traces, reducing the overhead on application developers.
- Semantic conventions: OTel enforces a common language for metadata, making it easier to correlate data across different services.
Here’s a minimal example of instrumenting an Express route with the OpenTelemetry SDK for Node.js. The key insight is that the tracer is initialized once at the application entry point, and then individual spans are created per operation — so you get granular timing data without polluting your business logic:
// tracing.js — initialize before importing anything else
const { NodeSDK } = require('@opentelemetry/sdk-node');
const { OTLPTraceExporter } = require('@opentelemetry/exporter-trace-otlp-http');
const { HttpInstrumentation } = require('@opentelemetry/instrumentation-http');
const { ExpressInstrumentation } = require('@opentelemetry/instrumentation-express');

const sdk = new NodeSDK({
  traceExporter: new OTLPTraceExporter({
    url: 'http://localhost:4318/v1/traces', // your OTel Collector endpoint
  }),
  instrumentations: [
    new HttpInstrumentation(),
    new ExpressInstrumentation(),
  ],
});

sdk.start();

// app.js
const { trace } = require('@opentelemetry/api');
const express = require('express');
const app = express();
const tracer = trace.getTracer('my-service');

app.get('/orders/:id', async (req, res) => {
  const span = tracer.startSpan('fetch-order');
  try {
    span.setAttribute('order.id', req.params.id);
    // your DB call here, e.g. MongoDB or PostgreSQL
    const order = await db.collection('orders').findOne({ _id: req.params.id });
    span.setAttribute('order.found', !!order);
    res.json(order);
  } catch (err) {
    span.recordException(err);
    res.status(500).json({ error: 'Internal error' });
  } finally {
    span.end();
  }
});
The reason this pattern matters is that span.recordException(err) automatically attaches the error details to the trace, which means when you look at a latency spike in Grafana Tempo or Jaeger, you can drill straight into the stack trace without separately digging through log files.
Contextual Logging and High Cardinality
Traditional logging often suffers from information overload where 90% of logs are never read, yet they consume a disproportionate share of the monitoring budget. The trend is moving toward structured logging combined with high-cardinality data. This means attaching rich metadata — such as customerId, requestId, and containerId — to every log entry. While this was historically expensive to index, modern databases like Loki and ClickHouse make it possible to store and query this data without the massive overhead of full-text indexing.
In a Node.js service, this looks like switching from console.log to a structured logger like Pino:
const pino = require('pino');
const logger = pino({ level: 'info' });

app.use((req, res, next) => {
  req.log = logger.child({
    requestId: req.headers['x-request-id'] || crypto.randomUUID(),
    userId: req.user?.id,
    path: req.path,
    method: req.method,
  });
  next();
});

app.get('/orders/:id', async (req, res) => {
  req.log.info({ orderId: req.params.id }, 'Fetching order');
  // ...
});
Every log line produced by req.log automatically carries the request context. When you ship these structured JSON logs to Loki or Elasticsearch, you can filter by userId instantly — no regex parsing required.
AIOps and the End of Alert Fatigue
One of the greatest challenges in modern operations is alert fatigue. When a single microservice fails, it can trigger a cascade of hundreds of alerts across dependent services. Human operators cannot process this volume of noise effectively. This is where Artificial Intelligence for IT Operations (AIOps) is making a tangible impact.
Modern monitoring tools increasingly use machine learning to establish dynamic baselines. Instead of setting a static threshold such as “alert if CPU exceeds 80%”, AIOps tools learn what is normal for 2:00 PM on a Tuesday. If CPU hits 80% but that is typical for a weekly batch job, no alert fires. Conversely, if CPU is at 40% but latency is three times higher than the usual baseline for that hour, the system flags it as an anomaly. The practical benefit is fewer pages at 3 AM for things that aren’t actually problems.
Automated Root Cause Analysis
Beyond noise reduction, AI is being used to perform automated root cause analysis. By analyzing the topology of a Kubernetes cluster and correlating it with recent CI/CD deployments, monitoring platforms can now surface observations like: “This latency spike started exactly 2 minutes after the v2.4.1 deployment of the payment service.” This creates a direct feedback loop between delivery and operations, enabling faster rollbacks and reducing the time engineers spend correlating events manually across dashboards.
Practical Strategies for Modern Monitoring
Implementing these trends requires more than buying a new tool — it requires a shift in how you design both your infrastructure and your application code. Here are concrete approaches to modernizing your stack.
- Implement Service Level Objectives (SLOs): Stop monitoring everything and start monitoring what matters to the user. Define an SLO (for example, 99.9% of requests must complete in under 300ms) and use error budgets to decide when to stop shipping features and start fixing reliability issues.
- Shift-left observability: Don’t wait for production to think about logs. Developers should use the same dashboards in local or staging environments. If you can’t debug a feature in staging using your monitoring tools, those tools aren’t ready for production.
- Cost-aware logging: Implement sampling for traces and logs. You don’t need to save 100% of “200 OK” responses. Save 100% of errors, but sample only 1% of successful requests to reduce storage and processing costs significantly.
- Infrastructure as Code for dashboards: Treat your Grafana dashboards and Prometheus alerting rules as code. Use tools like Terraform or Grizzly to provision your monitoring infrastructure so it is version-controlled, peer-reviewed, and reproducible across environments.
The Edge and eBPF
A technical trend worth watching closely is eBPF (extended Berkeley Packet Filter). It allows for deep observability at the Linux kernel level without modifying application code or deploying heavy sidecar containers. Tools like Cilium and Pixie use eBPF to provide instant visibility into network traffic and resource usage with near-zero overhead. This is particularly valuable in Kubernetes environments — and even in a Proxmox homelab running containerized workloads — where traditional agents often struggle with the dynamic nature of pods and short-lived processes. You get production-grade network telemetry without touching a single line of application code.
Conclusion
Monitoring and logging are no longer afterthoughts bolted on after deployment — they are foundational to running reliable software. The direction is clear: reduce noise through AI-driven baselines, standardize telemetry collection with OpenTelemetry, and control costs through smarter sampling and structured data. By moving from a reactive monitoring mindset to a proactive observability strategy, teams spend less time in war rooms and more time shipping.
Start by auditing your current alerting rules. If an alert doesn’t require immediate human intervention, delete it or convert it into a weekly report. Clear the noise first, then focus on the signals that actually affect your users.